The Amazing Transformation of Our Customer’s Incident Response with PagerDuty
One of the most crucial parts of maintaining and supporting production environments is managing production incidents. There are many questions we need to ask ourselves when we manage production incidents, and in this case study, I will share the challenges we faced at Hyp and how we solved them without additional costs and in a very simple and lean solution.
Our customer, Hyp, offers a comprehensive suite of payment solutions tailored for a variety of business needs, whether they are startups, larger companies, or freelancers. The services include online payment processing, digital invoicing, advanced point-of-sale systems, and integration with various e-commerce platforms. Hyp aims to simplify business operations by providing user-friendly interfaces for managing sales, inventory, and customer relations across multiple sales channels. Their platform facilitates both face-to-face and online transactions, while emphasizing ease and security in financial interactions.
When I started working with Hyp as the DevOps Leader at one of their departments, I joined Igor Rozenberg, a Senior DevOps engineer from develeap who already worked with a different department at Hyp.
When we reviewed Hyp’s current production architecture on AWS, we were impressed with the system’s stability, as we examined the production incident history over the years.
Obviously, when we reviewed the production monitoring system, we also reviewed the monitoring and logging tools like Datadog and Elasticsearch, which worked pretty well. The Datadog metrics were connected to Microsoft Teams so when a metric passed its threshold — a Teams message was sent to the DevOps channel as an alert.
The Challenge
What we did start to identify were the following facts:
- The metrics that were being used in the production environment could be better fine-tuned, especially their threshold definition. Metrics such as the following were in place: Memory usable on all hosts, CPU idle for all hosts, RDS metrics (such as CPU utilization, freeable memory, and free storage space).
- There are many more metrics that were missing and needed to be defined in order to better monitor our production system. The existing monitoring tools that were used included DataDog and CloudWatch.
Therefore, we fine-tuned the existing Datadog metrics on our production environment over AWS. The fine-tuning included redefining the thresholds for warnings and alerts and expanding the metrics to cover more servers in our architecture.
Moreover, we added more metrics that we identified as crucial for our production monitoring.
To make a long story short — after a few weeks of metrics fine-tuning, we received a Teams message regarding an unhealthy host in our production environment, which means a potential effect on our customers. Luckily, it didn’t affect our customers, but, I was worried about what could have happened in case we had this kind of incident happen outside working hours.
This time, we were able to react and fix this incident easily because it happened during working hours, and we received the Teams message.
This made me realize this is just a case where I need a system that can wake me up at night when a crucial production incident happens and affects my customers.
The Solution
When managing production incidents, it’s important to ask the following questions:
- What is the impact of the incident? It’s important to understand the severity of the issue and how it affects users, customers, or the business.
- Who needs to be notified about the incident? It’s important to communicate the incident to the relevant stakeholders, including customers, management, and the technical team.
- What are the immediate steps we can take to mitigate the impact of the incident? It’s important to take action quickly to minimize the impact of the incident.
- What is the timeline for resolving the incident? It’s important to set expectations for when the incident will be resolved and provide regular updates to stakeholders.
- What is the root cause of the incident? It’s important to identify the underlying issue to prevent similar incidents from occurring in the future.
- What can we do to prevent similar incidents from happening in the future? It’s important to learn from the incident and take steps to prevent similar incidents from occurring in the future, such as implementing better monitoring or improving processes.
- How can we improve our incident management process? It’s important to continuously evaluate and improve the incident management process to ensure that incidents are handled effectively and efficiently.
However, when we talk about the initial steps of incident management, we want to focus on the first 2 sections I mentioned above.
When implementing a production incident management system, we must identify the severity of every single metric we set, so that when an alert is sent to a team, we can understand the severity of the alert and the response time allowed for this kind of alert.
For example, a load balancer active connections metric threshold alert is probably less critical than the load balancer healthy host count threshold.
After assigning criticality to each type of alert, we need to define who are the people we want to notify for every critical threshold reached.
Why did we decide to implement PagerDuty?
A solution to our needs
Firstly, it answered our needs. We wanted to have a system that can be connected to our current Datadog metrics and when a critical alert has been sent, it will get me or my team notified, no matter what happens or where we are.
Personally, when I go to sleep, I turn off all my phone notifications. Including everything — messages, calls, teams, or whatever. The nice thing here is that PagerDuty can override this behavior and notify me whenever there is a critical issue, even when I’m in ‘Do not disturb mode’.
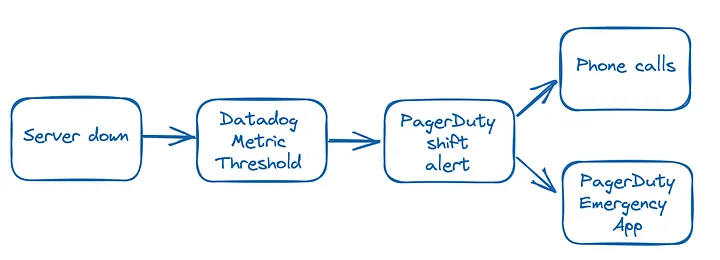
The alert flow is as follows:
Team size & pricing
Our DevOps team in Hyp isn’t large-sized. Moreover, the features we needed in our case were super minimal, which allowed us to use the free tier of PagerDuty to fulfill our needs. This made our decision very easy in order to start and try using the system.
In general, we can summarize the advantages of PagerDuty as follows:
- Centralized Incident Management — it provides a single platform to manage all incidents and alerts, which enables teams to have complete visibility into incidents, collaborate effectively and reduce response times.
- Integration with Multiple Tools — it can integrate with multiple monitoring, ticketing, and communication tools, which enables teams to receive alerts from various sources and manage incidents more effectively. Some of the popular tools that PagerDuty integrates with include Jira, Slack, Datadog, and New Relic.
- Mobile Support — it provides a mobile app that allows teams to receive alerts and notifications, respond to incidents, and collaborate with team members on the go, which helps to ensure that incidents are managed promptly and effectively.
- On-call Scheduling — it allows teams to manage their on-call schedules, which helps to ensure that incidents are assigned to the right people at the right time. It also provides features such as override schedules and on-call handoff, which enables teams to manage their on-call rotations more effectively.
- Automation and Intelligence — PagerDuty can automate incident management processes such as escalation policies and routing rules, which helps teams to reduce manual intervention and respond to incidents faster. It also provides intelligent insights into incidents, including root cause analysis and incident trends, which helps teams to improve their incident response processes. We didn’t use these features yet, but it looks like a powerful feature that we can use in case we need it.
However, while PagerDuty is a powerful incident management platform with many advantages, there are also some potential disadvantages that should be considered. Some of the main disadvantages of using PagerDuty for production incident management are:
- Cost — PagerDuty can be expensive. The platform is priced based on the number of users, so as your team grows, the cost of using PagerDuty can quickly add up.
- Complexity — PagerDuty can be complex to set up and configure, especially if you are integrating it with multiple tools. This can be challenging for smaller teams or teams that don’t have a dedicated DevOps resource. There is also complexity in large teams when you need to manage multiple shifts and escalation levels.
- Alert Fatigue — PagerDuty can generate a high volume of alerts, which can lead to alert fatigue and make it difficult for teams to prioritize and respond to critical incidents. Teams need to have effective alert management practices in place to avoid this.
- Limited Customization and Dependence on Third-Party Integrations — While PagerDuty provides many features and integrations, some teams may find that the platform doesn’t meet all of their specific needs. Customizing PagerDuty can also be challenging, as it requires technical expertise. It also relies on third-party integrations to function effectively, so any issues with these integrations can impact the platform’s reliability and functionality.
Results and benefits
After implementing PagerDuty as a part of our production monitoring and alerting system, we could confidently say that:
- We know exactly what metrics are critical for us to get notified at any given time in order to acknowledge and fix them as soon as possible
- We know exactly who we want to get notified
- (And most importantly) we can now tell how we identify critical incidents, filter them to reach the correct professionals, and eventually get the incident resolved as soon as possible with minimum effects on our customers.
* There are many other features in PagerDuty that we didn’t cover in this case study, that can be used in order to better manage your production environment.
Currently, this implementation helps us manage the current production architecture including AWS services such as EC2 instances, Application load balancers, S3, and more, and it will also help us in the future to manage incidents over our (near) future move to Kubernetes architecture.